 There are only three ways to grow an e-commerce business. -Getting more customers -Getting more repeat customers -Increasing the average order value To be able to really understand how your online store is growing you need to measure certain KPIs and track these regularly. KPIs can feel confusing and overwhelming. But I promise the time and effort that you put into tracking them will pay off. The best way to do this checking your Google Analytics or e-commerce dashboard reports weekly. In this article, I would like to talk you through the most important KPIs that will help you increase your sales. 1.Traffic : When you look at your Google Analytics Dashboard, the traffic source will show you where your visitors are coming from for example, organic search, paid ads, social media or Google ads. It’s important to track New vs returning visitor For a new website, new customers will be higher. But for an established business, ideally there should be a 50/50 split. It’s always great to have returning customers, because you’ll have build trust with them and they will tend to spend more money with you. 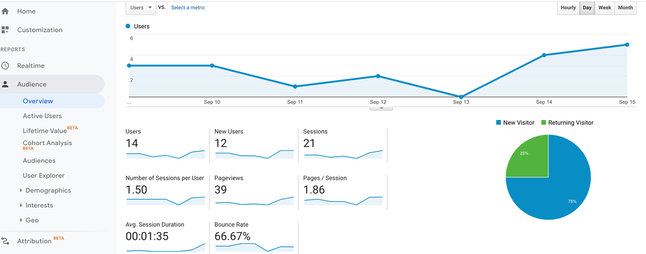 2.Bounce Rate: The bounce rate tells you how many users leave your website after viewing only one page. If your bounce rate is higher than 40%, you’ll need to investigate why visitors are leaving your website instead of exploring. High bounce rates also has a huge negative impact on SEO and paid traffic.
I strongly suggest you to check bounce rate of your home page as well as the bounce rate of the category and product pages. If you’re observing high bounce rates on any of these, then you can understand where the problem lies. 3. Average Order Value (AOV) Your average order value is the sum of the value of all of your orders (the total revenue for a period) divided by the total number of orders for that period. (You can see this in your Shopify dashboard) For example you might have 100 people spending an average of £10 or you might have 50 people spending £30. Trying to increase the AVO is easier than trying to acquire new customers. Therefore it's important to try and increase this value over time by upselling or cross selling other products. Generally speaking, having a higher AOV will help you run more profitable Facebook or Google ad campaigns. 4.Conversion Rate: To work out the conversion rate, divide the number of sales by the number of website visitors and then multiply it by 100 to get the percentage. Again if you've a Shopify website, you can see this KPI on your dashboard. Ideally you'd like your conversion rate to be a minimum of 2%. 5.Lifetime Value of the Customer is the overall revenue you forecast a customer to bring you during their lifetime, or span of time as your customer. This is especially important for subscription box business models. Because once you acquire that customer, as long as you keep them happy, they will stay with you longer, buying again every month. 6.Basket Abandonment Rate: Basket abandonment rate is calculated by dividing the number of completed purchases by the number of shopping baskets created. To turn the rate into a percentage subtract your number from one, and then multiply it by one hundred. Average basket abandonment rate for eCommerce websites is high, about 69 percent. If yours is higher, then you’ll want to look at the reasons why this is happening. Here are some common reasons why people don’t complete their checkout. -Unexpected delivery costs, -A complex check out process, -No Paypal or guest checkout option, -No info about return policy -Bad user experience I hope you find this helpful and if you need any more help understanding the data or how to optimise your website so that you can reach the optimum KPIs, just get in touch.
4 Comments
Rameen Samoo
11/6/2023 07:34:01 pm
I enjoyed reading your blog post. It was well-written and engaging. If you want to learn more, <a href="https://www.shopify.com" target="_blank">click here</a>.
ahsan
2/12/2023 09:41:46 pm
Thank you for discussing the potential of creating and selling print-on-demand products. It's a low-risk way to start an e-commerce business and make money. <a href="https://www.toprevenuegate.com/wgeaidq980?key=ff6b3c8feb4029b33ed1c6cf764a6e0e" target="_blank">click here</a> for more information.
Eli
30/1/2024 03:30:24 pm
Thank you for shedding light on a lesser-known aspect of this topic. Your post has expanded my understanding. <a href="https://c5078hs6tev9nbzj04wymc05yz.hop.clickbank.net" target="_blank">click here</a> for additional information. Leave a Reply. |
Archives
November 2021
Categories
All
|
 RSS Feed